
SemiconAlpha Real Time Indicators Update
SemiconAlpha Real Time Indicators Update
Adding a YoY comparison table to our Taiwan companies' monthly revenues

Regular readers will know that we like to pay particular attention to the monthly revenue reporting by certain Taiwanese companies that are key players in the global semiconductor supply chain. It helps give us a sense of what’s going on during a given quarter, without having to wait until quarterly results get reported. The following table show the latest results based on the reported February 2024 revenues.
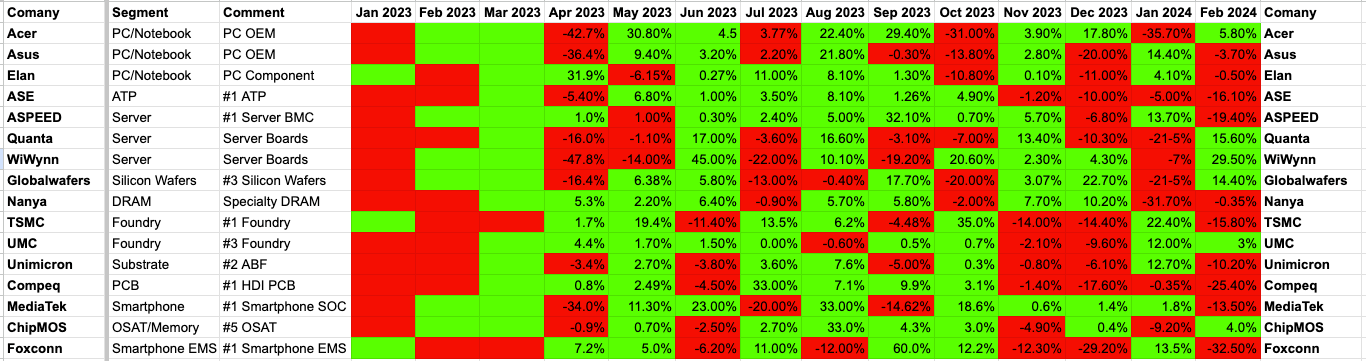
Table #1 Selected Taiwan Companies Monthly Revenue, MoM Change (%)
In the above table, if the MoM comparison is negative, the cell gets coloured red, if it’s positive, it gets coloured green. The number in each cell indicates that actual percentage increase or decrease. Clearly, there’s still quite a few red cells in the February data. More specifically, 10 out of the 16 MoM comps are negative, up from 8 in January.
Of particular interest is the strong performance of Quanta and WiWynn. We attribute this to the tailwinds they are likely experiencing as a result of the surge in demand for AI accelerated servers. Looking at the data for both January & February, what emerges is a kind of one step forwards, one step backwards kind of picture. A case in point is Unimicron, up 12.7% MoM in January, only to decline 10.2% MoM in February. The bottom line is that the recovery, such as we might call it, is still struggling to maintain its momentum.
MoM Comparison Anomalies
As we have previously discussed, comparing the MoM changes in revenue can present some difficulties. For example, certain companies consistently record lower revenues in the first month of each quarter, followed by higher revenues in the second and third months. Acer is a good example of such a company, Asus is similar, although not quite so consistent. In the case of these companies, comparing month 1 of a new quarter with month 3 of the previous quarter could give quite an erroneous impression of a negative trend which does not in fact exist. The end result is that one needs to understand these anomalies in order to correctly interpret what the MoM data means.
A number of readers have pointed out the a YoY comparison for the monthly data would be very useful, and this is certainly true. By doing the YoY comparison, we can basically eliminate any anomalies caused by companies having a particular pattern to their monthly data throughout the quarter. To that end, we have compiled the YoY data for our select group of Taiwan companies and present it below, along with our analysis of how we should interpret the data. Thanks as always for reading!
Keep reading with a 7-day free trial
Subscribe to Semicon Alpha to keep reading this post and get 7 days of free access to the full post archives.